We have about 1.5TB of parquet data in Gen 2 storage on Azure and we're trying to read it with a DataBricks cluster of 8 nodes each with 56gb and 16 cores. All I'm trying to do is some basic select('aColumn).distinct and where('anotherColumn < X).count()s.
Surprisingly, this is running like a dog: the first query takes about 50 minutes and the second about 18. Tuning is an empirical science but this felt wrong as 1.5TB of data is not that much these days.
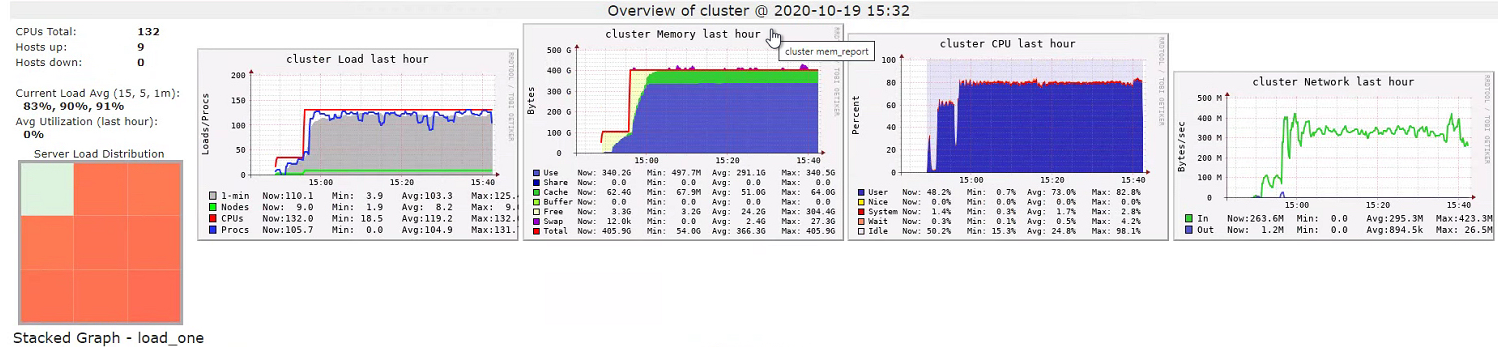 |
| Ganglia Metrics |
 |
| Spark GC logs |
 |
| Storage Tab |
Compare this to the storage tab when we're not using Delta Cache and you'll see there won't be any data in the "Parquet IO Cache". (Note that the page says "RDDs" when we're only using the Dataset API. This is standard). Anyway, enabling Delta Cache seemed to make no difference at all.
Using a "Delta Cache Accelerated" cluster actually made the initial distinct.count() take much longer (1.47 hours) with only marginally reduced time for the next query (16.8 minutes).
Disk is incredibly slow compared to memory. Ultimately, I was trying to process too much data with too little RAM and there's only so far tuning will get you before your metrics plateau. So, I made a cluster of 25 nodes each with 28gb of RAM and 8 cores. This did help but not as much as I was expecting. The distinct.count() now took 38 minutes and the where(...).count() 12 minutes. This is between a 25%-33% improvement but still seems a long time in absolute terms.
I want my Data Locality
The problem appears to be that all the data is pulled to the executors even if we're only interested in just one column [see StackOverflow]. Evidence for this came from another look at Ganglia:
 |
| Ganglia Metrics during second query |
"In Azure really fast networks compensate for having data and compute separated." [ibid] Indeed, the threads seemed to spend all their time on the first call in code to parse the Parquet rather than blocking on IO. But you can't get over the fact that my two queries are doing much the same thing (no joins) but the first takes three times longer than the second. To demonstrate, instead of two different queries, I ran the distinct.count() query twice. The first time took 42 minutes, the second 15. So, it appears that pulling 1.5TB of data from Gen2 into Spark takes about 25 minutes.
Azure is not the only cloud offering that implements this architectural trick. GCP takes all the data out of storage and puts it into an ephemeral HDFS cluster.
Solution
A new day, a new dawn. Let's start the cluster again and go from the beginning. This time, I won't explicitly enable IO cache and I won't even call .cache() on my DataFrame. To my amazement, the same query ran in about 30 seconds today! It seemed that this .cache() call was the root of my problems as re-introducing it returned us to a 50 minute wait. This is pretty much the opposite of what you'd expect with an on-prem Hadoop/YARN cluster.

No comments:
Post a Comment