Meta's much hyped Prophet seems to have problems identifying spikes in small numbers. For instance, we had a hospital that was admitting 4- to 5-times the normal number of patients on Fridays. Then, one day for whatever reason, Friday became a day like any other. Despite a lot of brute-force hyperparameter tuning, the ratio of RMSE/mean stayed at about 0.69.
 |
| Prophet (mis)handling significant behavioural change |
From the issues on Github, "by default the model will do a bad job on this time series because the model assumes smooth seasonality. That assumption comes because seasonality is modeled with a truncated Fourier series, which basically means it cannot change very rapidly."
You can add_regressors to the model but firstly I don't want to manually do this (I'd have to inspect thousands of data sets by-eye!) and when I tried it, my RMSE was worse - for reasons as yet unknown. Plots showed that it simply translated predictions for that spline down the y-axis; there was not change in how it treated the periodicity.
SARIMAX
On the same data, the default SARIMAX implementation in StatsModel gives you:
 |
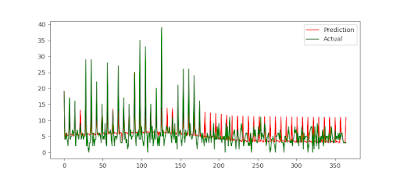
| SARIMAX with default values |
You need to explicitly tell it that there is weekly seasonality. In this case seasonal_order = (1, 0, 1, 7) works well. Note that 7 means we expect weekly behaviour. Indeed, SARIMAX quickly recognises the change:
 |
| SARIMAX with an explicitly provided seasonality |
Correlations
Don't be fooled by in-series correlations versus cross-series correlations. This SO link shows how the random walk generated by the tossing of two coins can appear to be correlated (just by luck) when of course they could not possibly be. This is because each have in-series correlation; each value in the cumulative total of HEADS-TAILS will be +/-1 the previous.
SciPy appears to have a tool to find the correlation between series even if the effect is lagged.
