Sunday, February 19, 2023

Diagnosing Spark Docker issues

I'm trying to talk on my host machine to a docker container running Spark. Unfortunately, upon connection I see:

Caused by: java.lang.RuntimeException: java.io.InvalidClassException: org.apache.spark.rpc.netty.RpcEndpointVerifier$CheckExistence; local class incompatible: stream classdesc serialVersionUID = 5378738997755484868, local class serialVersionUID = 7789290765573734431

This appears to be something of a known issue with this container.

We get the client code's classpath using SBT [SO]: 

sbt "export runtime:fullClasspath"

and taking the classpath for my module, we run:

serialver -classpath $FROM_ABOVE org.apache.spark.rpc.netty.RpcEndpointVerifier\$CheckExistence

which yields:

org.apache.spark.rpc.netty.RpcEndpointVerifier$CheckExistence:    private static final long serialVersionUID = 5378738997755484868L;

(The error message is coming from Spark master).

On the host, we login to the master container with:

docker exec -it $(docker ps | grep spark-master:3.2.1 | awk '{print $1}') /bin/bash

where we run:

for FILE in $(find spark/jars/) ; do { echo $FILE ; unzip -l $FILE | grep CheckExistence ; } done

and discover the class is in spark/jars/spark-core_2.12-3.2.1.jar. Hmm, the name suggests this Docker container has a Spark instance built with Scala 2.12 and I'm using Scala 3 which is compatible with 2.13 but not (apparently) 2.12.

Mounting the host file system from the container:

docker run -it -v /tmp:/mnt/disk bde2020/spark-master:3.2.1-hadoop3.2 /bin/bash

I copied all the Spark jars to a temporary folder. Then on the host:

CP="" ; for JAR in $(ls /tmp/jars/*.jar) ; do { CP="$CP:$JAR" ; } done
serialver -classpath $CP org.apache.spark.rpc.netty.RpcEndpointVerifier\$CheckExistence

yielded 7789290765573734431L.

So, at this point it appears I am SooL and need to get a new container.

Friday, February 17, 2023

Spark and Pandas

It seems that not just the PySpark driver but also the Spark JVM workers spawns Python daemons (see Obi Orciuch's blog)

Spark keeps a track of Python processes (source). In PythonWorkerFactory we read: "Because forking processes from Java is expensive, we prefer to launch a single Python daemon, pyspark/daemon.py (by default) and tell it to fork new workers for our tasks. This daemon currently only works on UNIX-based systems now because it uses signals for child management, so we can also fall back to launching workers, pyspark/worker.py (by default) directly. "

Indeed, running:

$SPARK_HOME/sbin/start-all.sh
$SPARK_HOME/bin/pyspark  --master=spark://127.0.1.1:7077


and then running in this shell:

something = 'hello ' * 1000000
another_string = spark.sparkContext.parallelize(something)
another_string.map(lambda a: a.upper()).take(100)

During all this, if you run:

watch -d "ps -ef | grep -i python | grep -v ps | grep -v grep"

you'll see a Python instance stared when the PySpark shell but also something like "python3 -m pyspark.daemon". If you find the parent of this process, you'll find it's a Java process called "CoarseGrainedExecutorBackend". This is a cluster worker.

Indeed, if you accidentally use a different Python version in your driver as your workers (the workers will default to the system's version of Python), you'll see errors like this:

Exception: Python in worker has different version 3.6 than that in driver 3.9, PySpark cannot run with different minor versions. Please check environment variables PYSPARK_PYTHON and PYSPARK_DRIVER_PYTHON are correctly set.

"Note that all data for a group will be loaded into memory before the function is applied. This can lead to out of memory exceptions, especially if the group sizes are skewed. The configuration for maxRecordsPerBatch is not applied on groups and it is up to the user to ensure that the grouped data will fit into the available memory." (Spark docs)

Also note that Wes McKinny, author of Pandas, notes "my rule of thumb for pandas is that you should have 5 to 10 times as much RAM as the size of your dataset" (albeit in 2017). 

The applyInPandas function is the gateway for Pandas in PySpark but be warned. "This function requires a full shuffle. All the data of a group will be loaded into memory, so the user should be aware of the potential OOM risk if data is skewed and certain groups are too large to fit in memory." (Spark docs)

There is some nice documentation here but theSpark code that passes the Python process all it needs is here in GitHub.

Wednesday, January 18, 2023

More ML pipeline debugings

The simpler model is sometimes better. 

We used Meta's Prophet to forecast the flow of patients between care providers. However, we had problems. 

First, the errors were pretty high when back testing. The average error over all care providers was about 20%.

Second, the sum of all care providers in a region was sometimes wildly larger than we'd expect. Curiously, the forecasts for the individual providers in the region were reasonably good.

Thirdly, even if the total numbers of patients flowing between care providers were plausible, it wasn't compatible with the model that forecast the number of patients at the care provider.

A simpler model

We tried a model that used just the historical average number of patients for a care provider. This calculation was over all data on the same day of the week and same month of the year (but ignoring the Covid pandemic when figures were weird).

Example: for any given Monday in January, we simply looked at the average flow between two nodes for all Mondays in every January over all non-Covid years. 

This approach yielded a lower error than Prophet - about 16%. See below for what metric we used to quantify the error. 

Odd figures

When we rendered the Prophet forecasts in the front-end application, they didn't seem too bad most of the time. For instance, we predict that 3027 people would go through the emergency departments in all hospitals in region X tomorrow when today it was 2795. OK, not too shocking.

But if we looked at flows with small numbers, the figures looked crazy. For instance, we predicted the number of people being discharged from all hospitals in a region into mental health units would be 15 tomorrow when this week it had actually averaged about 1.

One of the issues was Prophet itself. Prophet timeseries for small numbers may well have predictions below 0. Obviously, the users did not like us predicting a negative number of patients. But if we simply mapped all negative number to zero, we might get surprises.

Let's take some random numbers:

>>> import numpy as np 
>>> xs = np.random.normal(1, 2, 10)
>>> sum(xs)
9.788255911110234

but:

>>> gt0 = lambda x: 0 if x<0 else x
>>> sum(list(map(gt0, xs)))
12.020263767841016

The forecast for individual care providers was considered good even though Prophet would regularly predict, say, 1 person being sent from an emergency department to mental health facilities when often the figure was actually zero. 

But this 100% error was operationally fine for the clinicians because it was such a small number. It only became an issue when summed over all providers in the region. 

Absent data

We thought using the simpler, historical averages would solve this problem but it didn't. So, we took a closer look at the data. An emergency department would only discharge people into a mental health unit roughly once a week. In the absence of such a discharge, there would be no record. Why should there be? The hospitals only record events that happen not events that don't.

For both Prophet and historical averages, we're not feeding information into our model. But the absence of data is itself information! For instance, the averages of two series are different if you choose to ignore zeros:

>>> np.mean([5,0,0,0,0,3,0,0])
1.0
>>> np.mean([5,3])
4.0

Not a revelation when you think about it but backfilling this information via Spark was a bit gnarly. This StackOverflow answer helped. Once we did this, all figures agreed.

Vertices and Edges

Using historical data, the average flows between nodes necessarily summed to the values at the nodes. This was not true for independent Prophet models.

Imagine we have three care providers ab and c
The number of patients that daily flow through them are A, B and C respectively.
Patients flow from a to c and from b to c.
Let's say the flow from a to c is X and the flow from b to c is Y.

The expected number of patients flowing through c is therefore exactly:

E[C] = E[X+Y] = E[X] + E[Y]  

Compare this to Prophet (or any other model that takes just the historical C to forecast future C). In general:

E[C] != E[A] + E[B]

This is important at the front-end where users are complaining that the predicted flows on their screen don't add up.

Which error metric to use?

I was using root mean squared error to calculate errors whereas a colleague was using  mean absolute error. Which is most appropriate must be decided on a case by case basis. RMSE punishes a data set with a large number of outliers. Whereas, "If being off by 10 is just twice as bad as being off by 5, then MAE is more appropriate". Note that "MAE will never be higher than RMSE because of the way they are calculated" - see this SO answer.

Conclusion

Start with the simplest model you can. It's generally easier to implement, cognitively less demanding and chances are that it will give reasonable results anyway. If the results are not good enough, only then investigate shiny new toys.

Wednesday, December 21, 2022

Time series

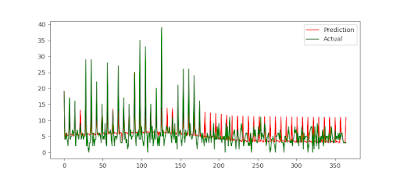
Meta's much hyped Prophet seems to have problems identifying spikes in small numbers. For instance, we had a hospital that was admitting 4- to 5-times the normal number of patients on Fridays. Then, one day for whatever reason, Friday became a day like any other. Despite a lot of brute-force hyperparameter tuning, the ratio of RMSE/mean stayed at about 0.69.

Prophet (mis)handling significant behavioural change

From the issues on Github, "by default the model will do a bad job on this time series because the model assumes smooth seasonality. That assumption comes because seasonality is modeled with a truncated Fourier series, which basically means it cannot change very rapidly."

You can add_regressors to the model but firstly I don't want to manually do this (I'd have to inspect thousands of data sets by-eye!) and when I tried it, my RMSE was worse - for reasons as yet unknown. Plots showed that it simply translated predictions for that spline down the y-axis; there was not change in how it treated the periodicity.

SARIMAX

On the same data, the default SARIMAX implementation in StatsModel gives you:

SARIMAX with default values

You need to explicitly tell it that there is weekly seasonality. In this  case seasonal_order = (1, 0, 1, 7) works well. Note that 7 means we expect weekly behaviour. Indeed, SARIMAX quickly recognises the change:

SARIMAX with an explicitly provided seasonality
And the overall RMSE/mean ratio becomes a little better at 0.61.

Correlations

Don't be fooled by in-series correlations versus cross-series correlations. This SO link shows how the random walk generated by the tossing of two coins can appear to be correlated (just by luck) when of course they could not possibly be. This is because each have in-series correlation; each value in the cumulative total of HEADS-TAILS will be +/-1 the previous.

SciPy appears to have a tool to find the correlation between series even if the effect is lagged.

Saturday, November 26, 2022

MLOps: debugging a pipeline

The domain

Healthcare in England is broken down into about 40 regions. For each region, we want to measure the differences in clinical outcomes conditioned on the ethnic and socioeconomic categories of the patients. To do this, we feed the data for each health region into a Spark GLM.

The problem

Everything was fine with our pipeline for six months before it started to blow up with:

Caused by: org.apache.spark.SparkException: Failed to execute user defined function(GeneralizedLinearRegressionModel$$Lambda$4903/0x0000000101ee9840: (struct<type:tinyint,size:int,indices:array<int>,values:array<double>>, double) => double)

Now, before we do a deep dive, the first thing to note is that we have a robust suite of tests that use synthetic data and they are all passing. 

Secondly, the code that was blowing up was used by five other data sets and they were all working fine in production.

If the code seems OK but one path through the ML pipeline was blowing up in code common to other paths, what does this suggest? Well, if it's not the code, there must be something suspicious about the data, right? The tests use synthetic data so of course they would pass.

The investigation

The first course of action when debugging is to take a good, long stare at the error. This might be obvious but many devs pay insufficient attention to it as it's generally a hundred lines of hard-to-read stack trace. This is like a detective who disregards the crime scene because there's too much evidence to collect. 

Anyway, our murder scene was full of Scala and Python stack traces but if we persevere, we find the line that was triggering the error was a call to Dataframe.collect(). This is generally suspicious but on this occasion, we knew we were dealing with a very small data set so this seemed safe. Indeed there were no OOMEs which is the most common problem with calls to collect()

But remember Spark is lazily evaluated. It could be something deeper in the stack that is the root cause. So, navigating a few stack frames previous, we see some one-hot encoding of ethnic groups. Hmm, what can go wrong with one-hot encoding? Well, one potential gotcha is when there is only one category, an exception will be raised.

However, this seemed unlikely. We break down ethnicities into only five groups and there are over a million people in each health region. It would be extraordinarily unlikely if there were a region that only had patients of a single ethnicity. 

Time to look at the data.

Any region with such homogenous patient data probably has very little data to begin with so lets count the number of rows per region. And bingo! there it is: a region called null that has a single (white) patient. This was a recent development in the data being fed into the model which explained why things had worked so well for so long.

The offending row comes from upstream data sets curated by a different department entirely so we're still considering what to do. For now, we could apply a band-aid and filter out any regions called null or better still, any region with fewer than a few thousand patients (as otherwise we're likely to get single cohorts).

One model to rule them?

At the end of the day, the code, the model and the data need to be considered holistically. For instance, which data sets you feed into a model must be evaluated beforehand. 

As an example, we also condition on age bands in this particular GLM model so if we were to feed neonatal or paediatric data into the model it would blow up as all patients would fall into the 0-18 age band. Obvious when you think about it but perhaps surprising if you've inherited somebody else's code.

Saturday, November 12, 2022

Architectural patterns

Some architectural terms (old and new) that I keep bumping into.

Eventual Consistency
"Eventual consistency — also called optimistic replication — is a consistency model used in distributed computing to achieve high availability that informally guarantees that, if no new updates are made to a given data item, ultimately all accesses to that item will return the last updated value.  Eventually-consistent services are often classified as providing BASE semantics (basically-available, soft-state, eventual consistency), in contrast to traditional ACID ... Another great model that can be directly implemented in the application layer is strong eventual consistency (SEC), which can be achieved via conflict-free replicated data types (CRDT), giving us the missing safety property of eventual consistency.  

"Event-driven applications usually favor eventual consistency, for the most part. However, we could also opt-in for strong consistency in particular system areas. Thus, it is fair to say we can combine both consistency models depending on our use case." - Functional Event-Driven Architecture, Volpe

The impacts of consistency on Microservices

Microservices should ideally be totally independent. For example, in a highway  management system, the weather service is totally orthoganol to the roadworks service even though both have an impact on congestion. However, microservices in the real world often have soft dependencies. As a result, "in a microservices world, we don’t have the luxury of relying on a single strongly consistent database. In that world, inconsistency is a given." [James Roper]

Hugo Oliviera Rocha outlines some antipatterns here. The first is "events as simple notifications. The source system publishes an event notifying the consumers that something changed in its domain. Then the consumers will request additional information to the source system... The main issue and the main reason why this option should be seldom used is when you apply it to a larger scale.

"[I]nstead of requesting the source system for additional information, it is possible to save the data internally as a materialized read model... The main issue isn’t the disk space, it is the initialization, maintenance, and keeping that data accurate."

He says event sourcing is just a band aid and suggests using fat (ie, denormalised) messages. The downside it they can be chunky.

CRDT
"To implement eventually consistent counting correctly, you need to make use of structures called conflict-free replicated data types (commonly referred to as CRDTs). There are a number of CRDTs for a variety of values and operations: sets that support only addition, sets that support addition and removal, numbers that support increments, numbers that support increments and decrements, and so forth." - Big Data, Nathan Marz

To a functional programmer, this looks a lot like semigroups and reducing.

Data Mesh
"Unlike traditional monolithic data infrastructures that handle the consumption, storage, transformation, and output of data in one central data lake, a data mesh supports distributed, domain-specific data consumers and views “data-as-a-product,” with each domain handling their own data pipelines. The tissue connecting these domains and their associated data assets is a universal interoperability layer that applies the same syntax and data standards." [TowardsDataScience]

"Data Mesh is a journey so you cannot implement Data Mesh per-se, you need to adopt the principles and start to make incremental changes." Adidas's journey [Medium]. Of the seven points given, two (decentralization and self-service) are the antithesis of ontologies.

Batch Views
"The batch views are like denormalized tables in that one piece of data from the master dataset may get indexed into many batch views. The key difference is that the batch views are defined as functions on the master dataset. Accordingly, there is no need to update a batch view because it will be continually rebuilt from the master dataset. This has the additional benefit that the batch views and master dataset will never be out of sync."  Big Data, Nathan Marz

Saga Pattern
"The Saga Pattern is as microservices architectural pattern to implement a transaction that spans multiple services. A saga is a sequence of local transactions. Each service in a saga performs its own transaction and publishes an event. The other services listen to that event and perform the next local transaction" [DZone]

Example in Cats here.

Type 1 and 2 data evolution
Slowly changing dimensions [Wikipedia] is a "concept that was introduced by in  Kimball and Ross in The Data Warehouse Toolkit."  A strategy could be that the data source "tracks historical data by creating multiple records. This is called a type 2 dimension." [The Enterprise Big Data Lake - Gorelik].  

Type 1 is overwritting a row's data as opposed to type that adds a new row.

Data Marts
Definitions for data marts tend to be a bit wooly but the best I heard was from a colleague who defined it as "data structured for use cases and particularly queries."

Data Marts tend to use type 2 dimensions (see above). 

Hexagon Architecture
Hexagon a.k.a Onion a.k.a Ports and Adapters "give us patterns on how to separate our domain from the ugliness of implementation." [Scala Pet Store on GitHub] This is an old pattern, as anybody who has written microservices will know, but the name was new to me.  The idea is that there are many faces the app shows the outside world for means of communication but the kernel inside "is blissfully ignorant of the nature of the input device." [Alistair Cockburn] This faciliates testing and reduces cognitive overhead that comes from having business logic scattered over many tiers and codebases.

Microservices
This is a huge area but here are some miscellaneous notes.

Before you jump on board with the Java based Lagom, it's worth noting that Martin Fowler wrote "Don't start with microservices – monoliths are your friend". This provoked a whole debate here. It's all worth reading but the comment that stuck out for me was:
"Former Netflix engineer and manager here. My advice:
Start a greenfield project using what you know ... Microservices is more often an organization hack than a scaling hack. Refactor to separate microservices when either: 1) the team is growing and needs to split into multiple teams, or 2) high traffic forces you to scale horizontally. #1 is more likely to happen first. At 35-50 people a common limiting factor is coordination between engineers. A set of teams with each team developing 1 or more services is a great way to keep all teams unblocked because each team can deploy separately. You can also partition the business complexity into those separate teams to further reduce the coordination burden."
A fine example of Conway's Law.

Builds in large organisations

Interestingly, Facebook report Git not being scalable. Meanwhile, Google uses Bazel which is supposed to be polyglot and very scalable.

Strangler Pattern
This is one of those obvious patterns that I never knew had a name.

"The Strangler pattern is one in which an “old” system is put behind an intermediary facade. Then, over time external replacement services for the old system are added behind the facade... Behind the scenes, services within the old system are refactored into a new set of services." [RedHat]

Downsides can be the maintenance effort.

Medallion architecture

This [DataBricks] divides data sets into bronze (raw), silver (cleaned) and gold (application-ready).

(GitHub) Action stations

Here are some notes I made on learning GitHub Actions:

There are some implicit environment variables. For instance, GITHUB_ENV (docs) is a temporary file that can hold environment variables like this:

          echo "ENVIRONMENT=develop" >> $GITHUB_ENV

This only appears to take an effect in the next run block.

In addition to these, there are contexts, which are "a way to access information about workflow runs, runner environments, jobs, and steps." For instance github.ref that refers to "the branch or tag ref that triggered the workflow run" (docs) and you use it with something like:

        if: endsWith(github.ref, '/develop')

To set up secrets you follow the instructions here. It asks you to go to the Settings tab on GitHub page. If you can't see it, you don't have permission to change them. You can reference these secrests like any other context. For example, to login to AWS:

      - name: Configure AWS Credentials
        uses: aws-actions/configure-aws-credentials@v1
        with:
          aws-access-key-id: '${{ secrets.AWS_ACCESS_KEY_ID }}'
          aws-secret-access-key: '${{ secrets.AWS_SECRET_ACCESS_KEY }}'
          aws-region: eu-west-2


Where aws-actions/configure-aws-credentials@v1 (and its ilk) are plugins to facilitate access to third party tools.

Contexts can also reference the output of actions. For example:

      - name: Login to Amazon ECR
        id: login-ecr
        uses: aws-actions/amazon-ecr-login@v1
      - name: 'Build, tag, and push image to Amazon ECR'
        env:
          ECR_REGISTRY: '${{ steps.login-ecr.outputs.registry }}'


Where login-ecr is an arbitrary ID but outputs.registry is part of the action's data structure.
