(Or NUMA, NUMA yay!)
Not all memory is equal. Some is faster to access that others. And how you access it is also important.
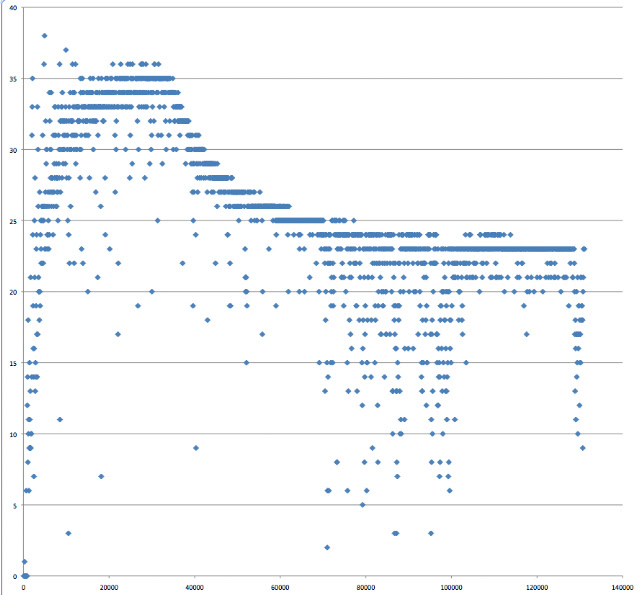
If you read through arrays of different lengths, you will probably get a performance profile that looks something like this:
Performance drops off around the 6MiB mark as that's the size of the L2 cache on my MacBook Pro (Intel Core 2 Duo). I know it's 6MiB by running:
phillip:~ henryp$ sysctl -a | grep cache
.
.
hw.cachelinesize = 64
hw.l1icachesize = 32768
hw.l1dcachesize = 32768
hw.l2cachesize = 6291456
.
.
It looks like what we're seeing is that as the L2 cache fills up with the array, performance drops.
A similar thing happens with the L1 cache which is 32KiB on this machine. (Note, it's the l1dcachesize that represents the memory cache. "L1d is the level 1 data cache, L1i the level 1 instruction cache" [1]).
Running the same code that generated the data in Figure 1 but with a much smaller range of array sizes, we get something like:
Here we see performance dropping off when arrays are about 32k. So much we'd expect. But look at the left hand side of the scatter graph. It takes a while for performance to reach the optimal point. This is nothing to do with something like the HotSpot compiler kicking in as all results in this post were from the second run. (The first run's results were discarded as the performance at start up was orders of magnitude slower than anything that followed).
It appears that the reason it's being slow initially is that an optimization has yet to kick in. That is, "Sequential locality, [which is] a special case of spatial locality, occurs when data elements are arranged and accessed linearly, e.g., traversing the elements in a one-dimensional array." [3]
The Intel docs say:
"The Intel® Core™ i7 processor has a 4 component hardware prefetcher very similar to
that of the Core™ processors. Two components associated with the L2 CACHE and two
components associated with the L1 data cache. The 2 components of L2 CACHE
hardware prefetcher are similar to those in the Pentium™ 4 and Core™ processors. There
is a “streaming” component that looks for multiple accesses in a local address window as
a trigger and an “adjacency” component that causes 2 lines to be fetched instead of one
with each triggering of the “streaming” component. The L1 data cache prefetcher is
similar to the L1 data cache prefetcher familiar from the Core™ processors. It has another
“streaming” component (which was usually disabled in the bios’ for the Core™
processors) and a “stride” or “IP” component that detected constant stride accesses at
individual instruction pointers. " [2]
It seems reasonable that this prefetching is responsible for the average time to read data from memory initially being low for smaller arrays. That is, memory needs to be accesses in a linear manner for some time before the CPU can assume that it will continue to be accessed in a similar manner. But more evidence will have to wait for my new (Linux) machine to arrive next week where I can there execute the commands to demonstrate what is happening to the machine's cache [4].
[4] Martin Thompson's blog.
Not all memory is equal. Some is faster to access that others. And how you access it is also important.
If you read through arrays of different lengths, you will probably get a performance profile that looks something like this:
 |
| Figure 1. Number of Java longs read per nanosecond vs. length of array (bytes) |
phillip:~ henryp$ sysctl -a | grep cache
.
.
hw.cachelinesize = 64
hw.l1icachesize = 32768
hw.l1dcachesize = 32768
hw.l2cachesize = 6291456
.
.
It looks like what we're seeing is that as the L2 cache fills up with the array, performance drops.
A similar thing happens with the L1 cache which is 32KiB on this machine. (Note, it's the l1dcachesize that represents the memory cache. "L1d is the level 1 data cache, L1i the level 1 instruction cache" [1]).
Running the same code that generated the data in Figure 1 but with a much smaller range of array sizes, we get something like:
 |
| Figure 2. Number of Java longs read per nanosecond vs. length of array (bytes) |
It appears that the reason it's being slow initially is that an optimization has yet to kick in. That is, "Sequential locality, [which is] a special case of spatial locality, occurs when data elements are arranged and accessed linearly, e.g., traversing the elements in a one-dimensional array." [3]
The Intel docs say:
"The Intel® Core™ i7 processor has a 4 component hardware prefetcher very similar to
that of the Core™ processors. Two components associated with the L2 CACHE and two
components associated with the L1 data cache. The 2 components of L2 CACHE
hardware prefetcher are similar to those in the Pentium™ 4 and Core™ processors. There
is a “streaming” component that looks for multiple accesses in a local address window as
a trigger and an “adjacency” component that causes 2 lines to be fetched instead of one
with each triggering of the “streaming” component. The L1 data cache prefetcher is
similar to the L1 data cache prefetcher familiar from the Core™ processors. It has another
“streaming” component (which was usually disabled in the bios’ for the Core™
processors) and a “stride” or “IP” component that detected constant stride accesses at
individual instruction pointers. " [2]
It seems reasonable that this prefetching is responsible for the average time to read data from memory initially being low for smaller arrays. That is, memory needs to be accesses in a linear manner for some time before the CPU can assume that it will continue to be accessed in a similar manner. But more evidence will have to wait for my new (Linux) machine to arrive next week where I can there execute the commands to demonstrate what is happening to the machine's cache [4].
[1] What Every Programmer Should Know About Memory, Ulrich Drepper
[3] Wikipedia.[4] Martin Thompson's blog.


