Showing posts with label Linux. Show all posts

Sunday, June 15, 2025

A Quick look at Quarkus


Microservice Framework

Quarkus depends a lot on SmallRye "a set of implementations of the MicroProfile specifications. We said that Quarkus is also a MicroProfile implementation, so this begs for a bit of explanation. Each SmallRye project implements one of the MicroProfile specifications" [1].

The MicroProfile specification is a set of standards for building microservice containers - for instance, handling Kubernetes health checks etc.

Native code

GraalVM has two main features: 
  • it allows polyglot development
  • it allows Ahead-of-Time (AOT) compilation.
This latter features is what Quarkus is interested in, although "Mandrel is a downstream (forked) distribution of the Oracle GraalVM CE with the main goal of providing a way to build a native executable specifically designed to support Quarkus... Mandrel focuses mainly on the native-image build tool. It doesn’t provide a full GraalVM toolset." [1]

Generate the binary with:

mvn package -Pnative

This defers to GRAALVM_HOME/bin/native-image and gcc. 

If we delegate to Graal, why use Quarkus at all? Well, Graal struggles with reflection. Quarkus provides shims that mean popular frameworks don't use reflection and can therefore be turned to native code.

Note that just because it produces an executable binary, the artifact still needs a garbage collector. In the output, you'll see:

Garbage collector: Serial GC (max heap size: 80% of RAM)

You don't need to use Quarkus to build native executables, though. For instance, if you tried to convert the Java port of Llama.cpp, you can build it with just make native - although note that I had to use version 24 of GraalVM as earlier versions didn't like the use of AVX (vector extensions).

Thread management

Much like Scala's Cats and ZIO, Quarkus facilitates execution engines. For instance it has a notion of blocking threads. "The @Blocking annotation on both methods tells Quarkus that the method executes a blocking operation (persist or delete) on a database, so it needs to execute on worker thread, which allows blocking." [1]
PolarisPrincipalAuthenticatorFilter

[1] Quarkus in Action (Manning)

Monday, February 3, 2025

NVidia Drivers on Linux

Whenever I do an upgrade, it generally goes well except for the video drivers. Updating is generally:

sudo apt update
sudo apt upgrade
sudo do-release-upgrade

and addressing any issues interactively along the way (for instance, something had changed my tlp.conf).

However, even after an otherwise successul upgrade, I was having trouble with my monitor. Firstly, the laptop screen was blank while the external was OK (the upgrade had not installed NVidia drivers); then the other way around; then the colours were odd (driver version 525).

At first, I went on a wild goose chase with missing X11 config. I think the conf file is supposed to be absent and the advice in this old askubuntu post is old. The official NVidia site itself was also not helpful.

I had to blat all NVidia drivers with [LinuxMint]:

sudo apt purge *nvidia*
sudo apt autoremove

I also updated the kernel with [askubuntu]:

sudo update-initramfs -u

and the kernel headers:

sudo apt install linux-headers-$(uname -r)

then (as recommended at askubuntu):

sudo ubuntu-drivers install nvidia:535

Version 535 seems stable and rebooting gave me a working system. YMMV.

I had tried 525 as sometimes the release before last is more stable (or so I read) but no joy. To clean them up, I needed to run:

sudo sudo mv /var/lib/dpkg/info/nvidia-dkms-525.* ~/Temp

as not all versions seem to be stable.

Saturday, October 26, 2024

NVIDIA Rapids

You can make Spark go faster by offloading some of the work to the GPU. There is an NVIDIA library (spark-rapids) to do this. 

A quick introduction

There are quite a few references to UCX in Spark Rapids. Assuming you have the hardware, this allows remote direct memory access (RDMA), basically sharing data in memory that circumvents the kernel.

"UVM or universal memory can allow main host memory to act essentially as swap for device(GPU) memory. This allows the GPU to process more data than fits in memory, but  can result in slower processing. This is an experimental feature." (from RapidsConf)

The spillStorageSize is the "Amount of off-heap host memory to use for buffering spilled GPU data before spilling  to local disk. Use -1 to set the amount to the combined size of pinned and pageable memory pools."

Old Ubuntu

Unfortunately, when running a test on Ubuntu 18 (I know, I know) I saw:

Caused by: java.lang.UnsatisfiedLinkError: /home/henryp/Code/Scala/SparkEcosystem/spark-rapids/integration_tests/target/tmp/cudf3561040550923512030.so: /lib/x86_64-linux-gnu/libc.so.6: version `GLIBC_2.28' not found (required by /home/henryp/Code/Scala/SparkEcosystem/spark-rapids/integration_tests/target/tmp/cudf3561040550923512030.so)
...
        at ai.rapids.cudf.NativeDepsLoader.loadDep(NativeDepsLoader.java:246)

After installing the latest Ubuntu on VMWare, it appears that you cannot access the GPU using VMWare Workstation.

You can however use a Docker image - just check that you have the Docker daemon that can handle NVIDIA installed by running:

henryp@adele: docker info | grep Runtimes 
Runtimes: io.containerd.runc.v2 nvidia runc

or 

henryp@adele:~$ grep -A2 -i nvidia /etc/docker/daemon.json
        "nvidia": {
            "path": "/usr/bin/nvidia-container-runtime",
            "runtimeArgs": []
        }

and download an image from here.

Now, I just need to run something like:

docker run --rm --gpus all  --runtime=nvidia  -it   -v /home/henryp/Code/Scala/SparkEcosystem/spark-rapids/:/home/henryp/Code/Scala/SparkEcosystem/spark-rapids/ -v /home/henryp/Tools:/home/henryp/Tools -v /home/henryp/.m2:/.m2  -v /usr/local/bin/Java:/usr/local/bin/Java  --user root  nvidia/cuda:12.6.1-devel-ubi8 /bin/bash

and once I'm in, run:

yum -y install git
yum -y install diffutils
yum -y install rsync
export MAVEN_HOME=/home/henryp/Tools/Build/Maven/Latest
export PATH=$MAVEN_HOME/bin:$PATH
export JAVA_HOME=/usr/local/bin/Java/Latest17
export PATH=$JAVA_HOME/bin:$PATH

Constantly installing some tools for Rapids to build proved a bit tedious, so I extended the NVIDIA docker image with this Dockerfile:

FROM nvidia/cuda:12.6.1-devel-ubi8

RUN yum -y install git
RUN yum -y install diffutils
RUN yum -y install rsync

Also, if I wanted to use mvnDebug [SO], I had to set the network of the container to host using --network host [SO]. Then, it's just a matter of running:

mvnDebug scalatest:test -DforkMode=never

and attaching a debugger from the host machine.

Unfortunately, sometimes when I close and re-open my laptop, the tests start failing with:

...
WindowedBlockIteratorSuite:
terminate called after throwing an instance of 'cudf::jni::jni_exception'
  what():  CUDA ERROR: code 999
/home/henryp/Tools/Build/Maven/Latest/bin/mvnDebug: line 36:   216 Aborted                 (core dumped) env MAVEN_OPTS="$MAVEN_OPTS" MAVEN_DEBUG_OPTS="$MAVEN_DEBUG_OPTS" "`dirname "$0"`/mvn" "$@"

Apparently, I must reboot my machine :(

Some miscellaneous code notes

Finally, I get to look at the code in action. Rapids adds RapidsExecutorPlugin (which extends the Spark ExecutorPlugin interface) that immediately initializes the GPU and memory (see GpuDeviceManager.initializeGpuAndMemory). Note that in setGpuDeviceAndAcquire we see a comment that says: 
"cudaFree(0) to actually allocate the set device - no process exclusive required since we are relying on Spark to schedule it properly and not give it to multiple executors"
This is why the tests (HashAggregatesSuite) a hard-coded to use just one CPU core.

Rapids then has a parallel set of classes that look a lot like the Spark classes that represent linear algebra structures. For example, there is a ColumnVector abstraction in both Spark and Rapids. The interesting Rapids one is GpuColumVector  - which implements this Spark interface - that can be instantiated by a GpuShuffleExchangeExecBase. Amongst other things, objects of these classes contain the address of their off-heap data and a reference counter.

Still playing.


Wednesday, October 25, 2023

Java and the GPU

Java was always built to abstract away the hardware on which it runs but it's approach to GPU has been somewhat late to the game [Gary Frost, YouTube].

There are projects out there that promise to give Java access to the GPU. I looked at Aparapi but it appears to be moribud. So, I gravitated to TornadoVM which Frost describes as "state of the art".

The trouble is that TornadoVM runs everything in a Docker image that has all the shared objects built in. This is fine for a quick demo - this is the result of running on my Quadro T2000:

docker-tornadovm$ ./run_nvidia_openjdk.sh tornado -cp example/target/example-1.0-SNAPSHOT.jar example.MatrixMultiplication
Computing MxM of 512x512
CPU Execution: 1.17 GFlops, Total time = 230 ms
GPU Execution: 268.44 GFlops, Total Time = 1 ms
Speedup: 230x

This demonstrates how the GPU runs a nested for-loop doing matrix multiplication much faster than the same code on the CPU. But it runs it all in a Docker container and I need to package a JAR everytime I make a change. How do I run it outside the container?

To work this out, I opened a shell in the Docker image and saw that the TornadoVM build it uses was built from Git branch d3062accc. So, the first thing was to checkout that branch of TornadoVM and build it.

I built with:

mvn clean install -Pgraal-jdk-11-plus

using the graalvm-ee-java11-22.3.4 JDK.

Note that you'll need Graal as the TornadoVM code has dependencies on it. I built my own Graal JDK by following the instructions here but using a different branch as I couldn't find the download for the graal.version defined in the TornadoVM pom.xml. Note, you'll also need mx and a bootstrapping JDK that has the right compiler interface (JVMCI), in my case labsjdk-ce-21.0.1-jvmci-23.1-b19.

So far, so good. I ran the tornado script which is just a wrapper around a call to the java executable (don't forget to set your JAVA_HOME environment variable to point at the Graal JDK) but it complained it could not see a tornado.backend file.

Again, a sneaky look at the Docker container indicated that we have to tell it which driver to use. So, I created the file and told it tornado.backends=opencl-backend but then tornado complained it didn't have the OpenCL drivers. Oops. 

You have to build the drivers you want seperately it seems. But if you try to build Tornado drivers without the native OpenCL dev library, you'll see:

TornadoVM/tornado-drivers/opencl-jni$ mvn clean install # yes, Maven cmake via cmake-maven-plugin
....
/usr/bin/ld: cannot find -lOpenCL
...


The Docker image saves you from having to install the OpenCL libraries on your machine. To get it working on bare metal, I played it safe and got an old Ubuntu box and installed them there. You'll need to install them with:

sudo apt install ocl-icd-opencl-dev

and then ran Maven in the opencl* sub directories. This time, the Maven build completed successfully.

However, running tornado in the subsequent dist folder still pukes but with something like:

Caused by: uk.ac.manchester.tornado.api.exceptions.TornadoRuntimeException: OpenCL JNI Library not found
at tornado.drivers.opencl@0.15.1/uk.ac.manchester.tornado.drivers.opencl.OpenCL.<clinit>(OpenCL.java:68)
... 11 more

Not what I was expecting. I found I needed to:

cp ./tornado-drivers/opencl-jni/target/linux-amd64-release/cmake/libtornado-opencl.so $TORNADO_SDK/lib

Where TORNADO_SDK is pointing at the relevent dist folder.

Now, finally, you can run on the bare metal:

$ tornado -cp target/classes/ example.MatrixMultiplication
Computing MxM of 512x512
CPU Execution: 1.21 GFlops, Total time = 222 ms
GPU Execution: 17.90 GFlops, Total Time = 15 ms
Speedup: 14x

(Results from an old NVIDIA GeForce GTX 650)

Note, you'll need to also run it with the Graal JVM. Set both the PATH and JAVA_HOME environment variables to point to it.

Where now?

This is a nice introduction to running Java on the GPU but it's just the start. There are many caveats. Example: what if your Java code throws an Exception? GPUs have no equivalent of exceptions so what happens then? More to come.

Monday, June 6, 2022

Packaging Python

Java programmers don't know the meaning of classpath hell until they've played with Python. Here are some notes I took while ploughing through the excellent Practical MLOps (Gift & Deza). Following their instructions, I as attempting to get a ML model served using Flask in a Docker container. Spoiler: it didn't work out of the box.

Since the correct OnnxRuntime wheel for my Python runtime did not exist, I had to build onnxruntime with --build-wheel while making the artifact.

This is where I encountered my first dependency horror:

CMake 3.18 or higher is required.  You are running version 3.10.2

when running onnxruntime/build.sh. (You can put a new version first in your PATH and avoid having to install it at the OS level).

This finally yielded onnxruntime-1.12.0-cp36-cp36m-linux_x86_64.whl which could be installed into my environment with pip install WHEEL_FILE... except that cp number must correspond to your Python version (3.6 in this case).

Moving virtual environments between machines is hard. You'd be best advised to use pip freeze to capture the environment. But ignoring this advice yields an interesting insight into the Python dependency system:

The first problem is that if you've created the environment with python -m venv then the scripts have your directory structure backed into them, as a simple grep will demonstrate. Copying the entire directory structure up to the virtual environment solved that.

But running the code gave me "No module named ..." errors. Looking at the sys.path didn't show my site-packages [SO] despite me having run activate. Odd. OK, so I defined PYTHONPATH and then I could see my site-packages in sys.path.

Then, you want to use exactly the same Python version. No apt-get Python for us! We have to manually install it [SO]. When doing this on a Docker container, I had to:

RUN apt-get update
RUN apt-get install -y wget
RUN apt-get install -y gcc
RUN apt-get install -y make
RUN apt-get install -y zlib1g-dev

Note that this [SO] helped me to create a Docker container that just pauses the moment it starts. This allows you to login and inspect it without it instantly dying on a misconfiguration.

The next problem: there are many compiled binaries in your virtual environment.

# find $PYTHONPATH/ -name \*.so | wc -l
185

Copying these between architectures is theoretically possible but the "as complexity of the code increases [so does] the likelihood of being linked against a library that is not installed" [SO]

Indeed, when I ran my Python code, I got a Segmentation Fault which can happen if "there's something wrong with your Python installation." [SO]

Python builds

A quick addendum on the how Python builds projects: the standard way is no longer standard: "[A]s of the last few years all direct invocations of setup.py are effectively deprecated in favor of invocations via purpose-built and/or standards-based CLI tools like pip, build and tox" [Paul Gannsle's blog]

Wednesday, May 25, 2022

The CLI for busy Data Scientists and Engineers

I've been asked to give a talk on the command line interface for a mixed audience of Data Scientists and Engineers. Since the world is becoming ever more container based, I'm focussing on Linux.

Containers

Sometimes you need to diagnose things within the container. Jump into the container with:

docker exec -it CONTAINER_ID /bin/bash

To get the basic diagnostic tools mentioned below, you'll generally need to execute:

apt-get update               # you need to run this first
apt-get install net-tools    # gives you netstat
apt-get install iputils-ping # gives you ping
apt-get install procps       # gives you ps
apt-get install lsof        

Note these installations will all be gone next time you fire up the image as the underlying image does not change.

You can find out which module your favourite command belongs to by running something like this:

$ dpkg -S /bin/netstat
net-tools: /bin/netstat

Formatting

You can use regex expressions in grep with the -P switch. For example, let's search for lines that are strictly composed of two 5-letter words seperated by a space:

$ echo hello world  | grep -P "\w{5}\s\w{5}$"
hello world
$ echo hello wordle | grep -P "\w{5}\s\w{5}$"
$

You can extract elements from a string with an arbitrary delimiter with awk. For example, this takes the first and sixth elements from a line of CSV:

$ echo this,is,a,line,of,csv | awk -F',' '{print $1 " " $6}'
this csv
$

To prettify output, use column like this:

$ echo "hello, world. I love you!
goodbye cruelest world! So sad" | column -t
hello,   world.    I       love  you!
goodbye  cruelest  world!  So    sad

$

To print to standard out as well as to a file, use tee. For example:

$ echo And now for something completely different | tee /tmp/monty_python.txt
And now for something completely different
$ cat /tmp/monty_python.txt 
And now for something completely different

To capture everything typed and output to your terminal (very useful in training), use script:

$ script -f /tmp/my_keystrokes.log
Script started, file is /tmp/my_keystrokes.log
$ echo hello world
hello world
$ cat /tmp/my_keystrokes.log 
Script started on 2022-05-13 16:10:37+0100
$ echo hello world
hello world
$ cat /tmp/my_keystrokes.log 
$

Beware its recursive nature! Anyway, you stop it with an exit.

You can poll an output with watch. For example, this will keep an eye on the Netty threads in a Java application (IntelliJ as it happens):

$ watch "jstack `jps | grep Main | awk '{print \$1}'` | grep -A10 ^\\\"Netty\ Builtin\ Server"

Note that the $1 has been escaped and the quote mark within the quote has been triple escapted. The switch -A10 is just to show the 10 lines After what we pattern matched. Backticks execute a command within a command. Of course, we can avoid this escaping with:

$ watch "jstack $(jps | grep Main | awk '{print $1}') | grep -A10 ^\\\"Netty\ Builtin\ Server"

Note that $(...).

Resources

The command htop gives lots of information on a running system. Pressing P or M orders the resources by processor or memory usage respectively. VIRT and RES are your virtual memory (how much your application has asked for) and resident memory (how much it's actually using) the latter is normally the most important. The load average tells you how much work is backing up. Anything over the number of processors you have is suboptimal. How many processors do you have?

$ grep -c ^processor /proc/cpuinfo 
16
$

The top command also lists zombie tasks. I'm told that these are threads that are irretrievable stuck, probably due to some hardware driver issue.

File handles can be seen using lsof. This can be useful to see, for example, where something is logging. For instance, guessing that IntelliJ logs to a file that has log in its name, we can run:

$ lsof -p 12610 2>/dev/null | grep log$
java    12610 henryp   12w      REG              259,3    7393039 41035613 /home/henryp/.cache/JetBrains/IntelliJIdea2021.2/log/idea.log
$

The 2>/dev/null pipes errors (the 2) to a dark pit that is ignore.

To see what your filewall is dropping (useful when you've misconfigured a node), run:

$ sudo iptables -L -n -v -x

To see current network connections, run:

$ netstat -nap 

You might want to pipe that to grep LISTEN to see what processes are listening and on which port. Very useful if something already has control of port 8080.

For threads, you can see what's going on by accessing the /proc directory. While threads are easy to see in Java (jstack), Python is a little more opaque, not least because the Global Interpretter Lock (GIL) only really allows one physical thread of execution (even if Python can allow logical threads). To utilise more processors, you must start a heavyweight thread (see "multiprocessing" here). Anyway, find the process ID you're interested in and run something like:

$ sudo cat /proc/YOUR_PROCESS_ID/stack
[<0>] do_wait+0x1cb/0x230
[<0>] kernel_wait4+0x89/0x130
[<0>] __do_sys_wait4+0x95/0xa0
[<0>] __x64_sys_wait4+0x1e/0x20
[<0>] do_syscall_64+0x57/0x190
[<0>] entry_SYSCALL_64_after_hwframe+0x44/0xa9

as everything is a file in Unix, right? This happens to be the stack in Python code that is time.sleeping. You'll see a similar looking stack for a Java thread that happens to be waiting.

If you want to pin work to certain cores, use something like taskset. For example, if I wanted to run COMMAND on all but one of my 16 cores, I run:

taskset 0xFFFE COMMAND

This is very useful if some data munging is so intense it's bringing my system down. Using this, at least one thread is left for the OS.

Finally, vmstat gives you lots of information about the health of the box such as blocks being read/written from/to disk (bo/bi), the number of processes runnable (not necessarily running) and the number blcoked (r/b) and the number of context switches per second (cs)

Saturday, May 23, 2020

When Penguins Attack


It's that moment that everybody who auto updates their laptops fears: it doesn't work. My problem was that after logging in, the OS paused briefly and then sent me back to the login screen. Hmm.

In this situation, get a CLI prompt with CTRL-ALT-F3. Since we managed to get a login prompt and then failed, it's probably the video drivers. I checked and saw a message similar to this (segmentation fault) in /var/log/Xorg.0.log

Foolishly, I chose to rollback a recent kernel update by updating /etc/default/grub. This is a matter of setting GRUB_DEFAULT to a number indicating how many steps back you want (0 obviously uses the most recent). Don't forget to run sudo update-grub when you're done.

This was foolish as I had rolled back to a kernel version that before a recent BIOS update. Now, things were much worse as my laptop could not get past the BIOS screen. Great. Even trying holding down shift at boot time to allow me change kernels didn't work.

If you've bought a Dell (I have a Precision 7540, an ugly but decent machine), you'll be given a System Service Tag on the the invoice they've sent you. Give Dell this ID here and download a recovery ISO. I tried phoning Dell Support but they never got back to me.

Create a bootable USB using Startup Disk Creator. Naturally, you'll need another Ubuntu machine to do this.

As  it happens, this startup disk just tries to install another version of Ubuntu which blew a bit of disk space but there was no reason to do this. I just dropped to a CLI with CTRL-ALT-F3 and saw what hard disks there were with fdisk -l, identified the partition that was clearly mine (at over 800gb) and mounted it with:

mount /dev/MY_DISK  /mnt/old

(this SO answer proved invaluable). Now I can read my old disk. Good.

Now, I can rollback the change I made to my grub file and sudo update-grub again. But first, I needed to chroot that mounted disk to pretend it's running as my root file system. Don't forget to also mount other important mount points to make it look genuine. This SO answer will help.

Rebooting got me back to my original problem of not being able to run XServer. The solution was: keep the kernel and rollback the graphics driver updates with a third SO answer here. For me, this was sudo apt-get purgeing all things NVIDIA and running sudo apt-get install nvidia-driver-430 (the driver version may be different for you).

Rebooting once more got my system back but c'mon you guys at Dell and Ubuntu - don't break my system. That's a few hours I won't get back.

Saturday, July 26, 2014

UDP and Full Buffers


Oracle's Coherence has a very nice reporting tool. If you don't have it running by default, you can connect via JConsole and turn it on. Give it a directory and it will print cluster statistics to it every minute.

The reason we need these stats is that on a quiet system, the percentage of packets dropped on some nodes can be terrible. I've been looking at why.

Oracle Coherence nodes talk to each other via UDP. Unlike TCP, nothing is ensuring our packets reach their destination. To counter this, Coherence builds its own protocol on top of UDP that resends packets if they have not been acknowledged or if the sender receives a NACK.

On a decent network, why would our packets not reach their destination? Well, one reason is that the receiving buffer is full. We've set our buffers at 2MB (per Oracle's advice) so this is unlikely but possible. If an application receives UDP packets faster than it can process them, packets will be dropped.

However, if you're running on Linux, you can easily see if this is the case.

henryp@phillsdell:~$ netstat -su 
.
.
Udp:
    3196 packets received
    9 packets to unknown port received.
    0 packet receive errors
    2770 packets sent

It's the packet receive errors count that is of interest to us. Although the packet is discarded, Linux will at least make a note of its loss.

The mystery continues as we are seeing nothing like the packet loss here that would explain the number of Coherence re-sends. 

Our cluster is saying that the number of resends ("when there is no ACK received within a timeout period" [1]) and the number resent early ("a packet is resent ahead of schedule when there is a NACK indicating that the packet has not been received" [1]) is high.

These resends appear necessary as the excess figure ("the total number of packet retransmissions which were later proven unnecessary" [1]) was low.

Note that you would not necessarily expect the publish success rate to correlate with receive success rate. They measure unrelated metrics. "Publisher success rate is a ratio of the number of packets successfully delivered in a first attempt to the total number of sent packets" [1]. Whereas the receiver rate is measures unnecessary redelivery. "Failure count is incremented when a re-delivery of previously received packet is detected. It could be caused by either very high inbound network latency or lost ACK packets." [2]

Our network guys assure us that our Cisco kit is not reporting anywhere near enough lost UDP packets to explain Coherence's need to resend packets, neither does the OS when reporting lost packets on the NICs. 

What's more, put a load through the system does not change the absolute number of resends - therefore as a percentage of overall packets, this pathological metric drops. This is also the case when we put a lot of load on the network with the datagram tester that comes with Coherence.

We are perplexed.

[1] Coherence docs.

[2] Coherence docs.

Monday, May 26, 2014

Debugging the JVM


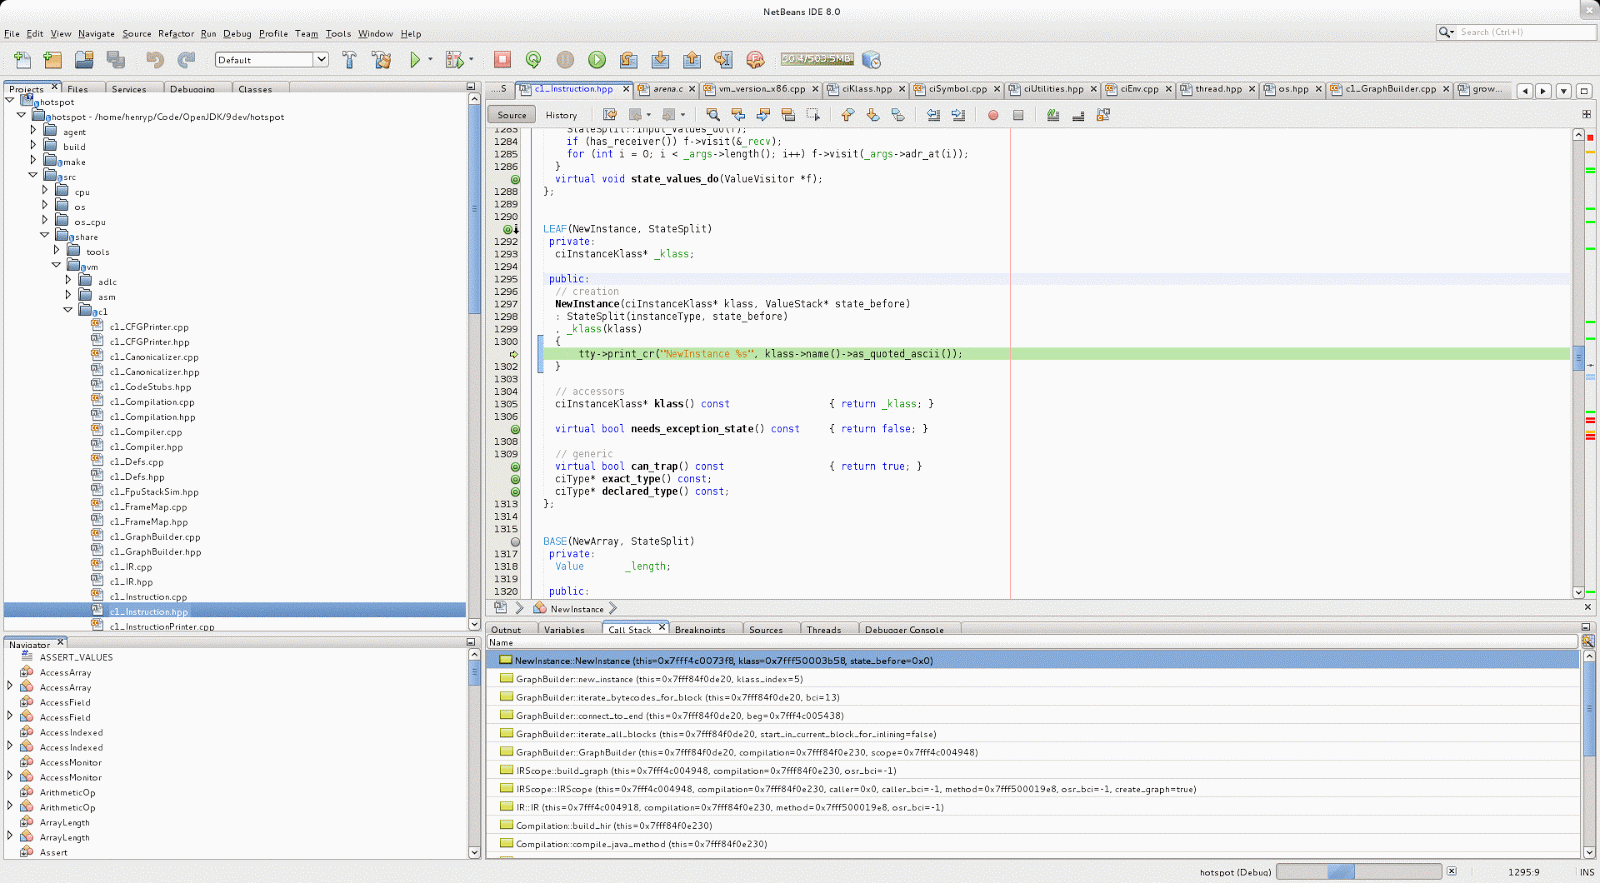
This is very nice. I've built my own JDK on Linux and am stepping through the C++ code as if it were a normal Java debug.


To do this:

1. Get the source code with:

hg clone http://hg.openjdk.java.net/jdk9/dev 9dev

2. Build with something like:

$ bash ./configure --with-debug-level=slowdebug --enable-debug-symbols ZIP_DEBUGINFO_FILES=0
$ make all CONF=linux-x86_64-normal-server-slowdebug ZIP_DEBUGINFO_FILES=0

or whichever CONF is appropriate to your system. This last step can take quite a long time (about 10 minutes).

The ZIP_DEBUGINFO_FILES is important (see here and here). This compiles the symbols into the artifact that allow debugging.

[Note: sometimes, I saw errors like:

gmake[2]: *** [/home/henryp/Code/OpenJDK/9dev/build/linux-x86_64-normal-server-slowdebug/jdk/demo/jpda/examples.jar] Error 1
gmake[2]: *** Waiting for unfinished jobs....
Note: Some input files use or override a deprecated API.
Note: Recompile with -Xlint:deprecation for details.
Note: Some input files use unchecked or unsafe operations.
Note: Recompile with -Xlint:unchecked for details.
gmake[1]: *** [demos] Error 2
make: *** [demos-only] Error 2

which were worrying. In the event of this, I ran make again and it worked. Hmm.]

3. Install NetBeans 8.x. Although I am normally an Eclipse man, NetBeans is frankly better for C/C++ development.

4. Create a new C/C++ application in the hotspot directory. 

5. Choose a Java main class to run by right clicking on the project properties and in the "Run" Category. Choose the class to run using the artifact that was built, eg something like:

"${OUTPUT_PATH}" -classpath /home/henryp/Workspaces/workspaceKepler/_MyTests/bin com.phenry.memory.ObjectCreatorMain

6. Insert your breakpoints wherever you wish and press the debug button. Note, if you are remote debugging and your system has been "hardened" for security reasons, you may have some trouble. Follow the instructions here (and the subsequent link) to turn off the security.

A Caveat

Finally, when debugging, you will be using Linux tools. I had problems on an Ubuntu 12.04 system as the tools were not up-to-date (the debugger acts erratically when debugging multi-threaded code). On my Fedora system, everything was fine. The versions I was using were:

[henryp@corsair 9dev]$ gdb -version
GNU gdb (GDB) Fedora (7.4.50.20120120-54.fc17)
.
.
[henryp@corsair 9dev]$ gcc --version
gcc (GCC) 4.7.2 20120921 (Red Hat 4.7.2-2)
.
.


Monday, May 12, 2014

How do you distinguish a slow application from a slow network?


We've been given new hardware on which to run our application. To make sure it will be OK, we ran our performance tests against it. To our surprise, they sometimes did poorly despite the new CPUs being much better. Using jstack showed at any particular time, nothing much was going on.

First we looked at playing with OS parameters but we had no luck. Then we looked at esoteric things like traffic shaping but found nothing.

So, time to crack open Wireshark. We took a 60s sample of network traffic when things were going well as a baseline then sampled for 60s during slowness.

Although the application's functionality was fine during both samples, the TCP/IP traffic showed big differences. The slow traffic had lots of re-transmissions and "TCP ACKed lost segment" messages in the log.

To filter them in Wireshark, use:

tcp.analysis.lost_segment || tcp.analysis.retransmission

(Incidentally, another interesting filter is:

frame.time_delta > 0.1

which shows packets that had a gap between them of 0.1s - which is ages in the traffic world. Another is

tcp.window_size == 0

which shows your buffers filling up)

In our 60s capture on the client side, there were some 2 million frames captured. Of these, some 83 000 we re-transmissions or lost segments. This is 4% of our traffic and seems enough to slow our connections noticeably.

We've been assured by the hardware guys everything is fine. But we do share a VLAN (that is, we share physical networks with other teams) and that may be exhausted. This piece of kit is a Cisco Nexus 5k.

The mystery continues.


Saturday, May 10, 2014

CPU affinity and Performance

The Problem

I have a single-threaded application (my play-project, JStringServer, running BatchedServerMain) that is very CPU and IO heavy and I want to improve its performance and stop it from jittering.

By running htop, I notice that it jumps from CPU to CPU. One moment it's on CPU 6...


the next, it's on CPU 11:


The number of serviced clients per second is all over the place (a mean of 9523 per second and a standard deviation of 864. Compare this with the results below).

The Solution

You might have read a lot about CPU affinity on the blogosphere (such as HighScalability and Mechanical Sympathy). Jumping between CPUs can be expensive and one tactic is to avoid it. Could it help me?

I've heard of proposals to allow this to be done within Java but there is nothing I know of that allows you to do it yet so I will have to do it via the OS.

CPU Affinity

You can pin processes to given CPUs quite easily on Linux (see this article for instructions). But which do we pin it to? Not all are the same...

I pin my process to each CPU and take timings by hitting the process from another box. These are the results I get measuring the number of clients serviced each second:

0 : mean =  10244.200 std dev =     47.298
1 : mean =  10253.600 std dev =     52.063
2 : mean =  10245.400 std dev =     48.202
3 : mean =  10204.800 std dev =     47.422
4 : mean =  10265.000 std dev =     54.902
5 : mean =   7807.400 std dev =     41.105
6 : mean =  10217.400 std dev =     51.623
7 : mean =  10274.000 std dev =     46.656
8 : mean =  10238.600 std dev =     62.919
9 : mean =  10290.600 std dev =     49.318
10 : mean =  10209.400 std dev =     52.044
11 : mean =  10194.800 std dev =     54.377
12 : mean =  10243.400 std dev =     52.321
13 : mean =   8874.000 std dev =     43.959
14 : mean =   9849.200 std dev =     49.794
15 : mean =  10352.000 std dev =     55.194

Hmm, three CPUs are slow, but especially CPU #5.

Let's look at my system. I'm using an Intel Xeon processor (E5-2687W) which has 8 cores and 16 hardware threads.

[henryp@corsair ~]$ numactl -H
available: 1 nodes (0)
node 0 cpus: 0 1 2 3 4 5 6 7 8 9 10 11 12 13 14 15
node 0 size: 65480 MB
node 0 free: 60931 MB
node distances:
node   0
  0:  10

This shows I have only one CPU and memory nodes so I don't have to worry about cross-socket NUMA problems (This is a good article about looking at NUMA and hardware).

OK, so what are all my CPUs in my socket doing?

[henryp@corsair 9dev]$ cat /proc/interrupts
            CPU0       CPU1       CPU2       CPU3       CPU4       CPU5       CPU6       CPU7       CPU8       CPU9       CPU10      CPU11      CPU12      CPU13      CPU14      CPU15      
   0:        171          0          0          0          0          0          0          0          0          0          0          0          0          0          0          0   IO-APIC-edge      timer
   1:       3644          0          0          0          0          0          0          0          0          0          0          0          0          0          0          0   IO-APIC-edge      i8042
   4:          2          0          0          0          0          0          0          0          0          0          0          0          0          0          0          0   IO-APIC-edge    
   8:          1          0          0          0          0          0          0          0          0          0          0          0          0          0          0          0   IO-APIC-edge      rtc0
   9:          0          0          0          0          0          0          0          0          0          0          0          0          0          0          0          0   IO-APIC-fasteoi   acpi
  12:     132544          0          0          0          0          0          0          0          0          0          0          0          0          0          0          0   IO-APIC-edge      i8042
  17:          1          0          0          0          0          0          0          0          0          0          0          0          0          0          0          0   IO-APIC-fasteoi   firewire_ohci
  23:         61          0          0          0          0          0         21          0          0          0          0          0          0          0          0          0   IO-APIC-fasteoi   ehci_hcd:usb1, ehci_hcd:usb2
  27:          0          0          0          0          0          0          0          0          0          0          0          0          0          0          0          0   IO-APIC-fasteoi   ath9k
  32:     207183          0          0          0          0          0          0          0          0          0          0          0          0          0          0          0   IO-APIC-fasteoi   nvidia
  36:        179          0          0          0          0          0          0          0          0          0          0          0          0          0          0          0   IO-APIC-fasteoi   snd_hda_intel
  64:      27439      25657      81300          0       6288      32731       5618      45423          0          0          0          0          0          0          0          0   PCI-MSI-edge      ahci
  65:          5          0          0          0          0          0          0          0          0          0          0          0          0          0          0          0   PCI-MSI-edge      ahci
  66:          0          0          0          0          0          0          0          0          0          0          0          0          0          0          0          0   PCI-MSI-edge      xhci_hcd
  67:          0          0          0          0          0          0          0          0          0          0          0          0          0          0          0          0   PCI-MSI-edge      xhci_hcd
  68:          0          0          0          0          0          0          0          0          0          0          0          0          0          0          0          0   PCI-MSI-edge      xhci_hcd
  69:          0          0          0          0          0          0          0          0          0          0          0          0          0          0          0          0   PCI-MSI-edge      xhci_hcd
  70:          0          0          0          0          0          0          0          0          0          0          0          0          0          0          0          0   PCI-MSI-edge      xhci_hcd
  71:          0          0          0          0          0          0          0          0          0          0          0          0          0          0          0          0   PCI-MSI-edge      xhci_hcd
  72:          0          0          0          0          0          0          0          0          0          0          0          0          0          0          0          0   PCI-MSI-edge      xhci_hcd
  73:          0          0          0          0          0          0          0          0          0          0          0          0          0          0          0          0   PCI-MSI-edge      xhci_hcd
  74:          0          0          0          0          0          0          0          0          0          0          0          0          0          0          0          0   PCI-MSI-edge      xhci_hcd
  75:          0          0          0          0          0          0          0          0          0          0          0          0          0          0          0          0   PCI-MSI-edge      xhci_hcd
  76:          0          0          0          0          0          0          0          0          0          0          0          0          0          0          0          0   PCI-MSI-edge      xhci_hcd
  77:          0          0          0          0          0          0          0          0          0          0          0          0          0          0          0          0   PCI-MSI-edge      xhci_hcd
  78:          0          0          0          0          0          0          0          0          0          0          0          0          0          0          0          0   PCI-MSI-edge      xhci_hcd
  79:          0          0          0          0          0          0          0          0          0          0          0          0          0          0          0          0   PCI-MSI-edge      xhci_hcd
  80:          0          0          0          0          0          0          0          0          0          0          0          0          0          0          0          0   PCI-MSI-edge      xhci_hcd
  81:          0          0          0          0          0          0          0          0          0          0          0          0          0          0          0          0   PCI-MSI-edge      xhci_hcd
  82:         10          0          0          0          0          0          0          0          0          0          0          0          0          0          0          0   PCI-MSI-edge      mei
  83:       1576          0          0          0          0          0          0          0          0          0          0          0          0          0          0          0   PCI-MSI-edge      em1
  84:        757          0          0          0          0          0          0          0          0          0          0          0          0          0          0          0   PCI-MSI-edge      snd_hda_intel
  85:         14          0          0          0          0     424447          0          0          0          0          0          0          0          0          0          0   PCI-MSI-edge      p7p1-rx-0
  86:         19          0          0          0          0          0     216701          0          0          0          0          0          0          0          0          0   PCI-MSI-edge      p7p1-tx-0
  87:          2          0          0          0          0          0          0          0          0          0          0          0          0          0          0          0   PCI-MSI-edge      p7p1
 NMI:        332        254        231        207        211        310        218        219        403        303        194        228        280        382        329        281   Non-maskable interrupts
 LOC:     418851     409978     386151     360594     358830     438636     351885     362193     292543     243019     179805     188224     223758     283426     257005     225531   Local timer interrupts
 SPU:          0          0          0          0          0          0          0          0          0          0          0          0          0          0          0          0   Spurious interrupts
 PMI:        332        254        231        207        211        310        218        219        403        303        194        228        280        382        329        281   Performance monitoring interrupts
 IWI:          0          0          0          0          0          0          0          0          0          0          0          0          0          0          0          0   IRQ work interrupts
 RTR:         15          0          0          0          0          0          0          0          0          0          0          0          0          0          0          0   APIC ICR read retries
 RES:    1069726      92676      20752       8650       5003       4081       3523       2631       2234       2171       2467       1658       1974       1873       1849       1668   Rescheduling interrupts
 CAL:      53667      72109      69200      68746      62293      82125      72462      71374      49909      51974      52292      54965      55904      52059      54509      54112   Function call interrupts
 TLB:          0          0          0          0          0          0          0          0          0          0          0          0          0          0          0          0   TLB shootdowns
 TRM:          0          0          0          0          0          0          0          0          0          0          0          0          0          0          0          0   Thermal event interrupts
 THR:          0          0          0          0          0          0          0          0          0          0          0          0          0          0          0          0   Threshold APIC interrupts
 MCE:          0          0          0          0          0          0          0          0          0          0          0          0          0          0          0          0   Machine check exceptions
 MCP:         12         12         12         12         12         12         12         12         12         12         12         12         12         12         12         12   Machine check polls
 ERR:          0
 MIS:          0

(Read this page to see how best to read this output).

CPU #5 seems to be handling an awful lot of interrupts from the network interface controller [NIC] for p7p1 (the name of my interface that the client is hitting).

"Unfortunately the default is to let all processors handle interrupts with the result that the overall performance is not optimal in particular on multi-core systems. This is because modern NICs can have multiple RX queues that work perfectly if cache coherency is respected. This means that interrupts for ethX-RX queue Y must be sent to 1 (one) core or at most to a core and its Hyper-Threaded (HT) companion. If multiple processors handle the same RX queue, this invalidates the cache and performance gets worse. For this reason IRQ balancing is the key for performance." [1]

OK, let's balance that puppy.

[root@corsair ~]# echo 15 > /proc/irq/85/smp_affinity ; echo 15 > /proc/irq/85/smp_affinity_list 

This works for a few seconds and I see the same throughput levels as the other CPUs but then my Fedora 17 reverts it! How annoying. It doesn't do that on my Ubuntu 12.04 (admittedly on different hardware).

So, I use Tuna to see what's going on. This is how it looks before the test:


And during:


We can see CPU #5 is handling a lot of kernel interrupts.

Conclusion

It seems that this particular CPU is busy handling network IO and making my process perform badly if I pin it to it. This is probably a reason for the jitter as the kernel sometimes schedules my process to run on it.

But at the moment, I don't know how to stop the kernel from disabling network interrupts on this CPU. So, I'll just avoid it in the future.

[1] http://www.ntop.org/pf_ring/irq-balancing/
