Showing posts with label openjdk. Show all posts

Monday, October 13, 2014

What exactly triggers a Garbage Collection?


After playing with the OpenJDK C++ code, I found a good resource of documentation here. But this is a log of my own journey through the OpenJDK code that was prompted by workmates asking: what exactly is it that prompts a garbage collection?

Since we were using the parallel scavenge GC, I had a look in the code at ParallelScavengeHeap::mem_allocate. (We've tried G1 but failed to get good performance out of it. After a few hours, all target collection times were violated and over time it became slower and slower).

First, we try to allocate the memory from the young generation:

  HeapWord* result = young_gen()->allocate(size);

Hopefully, this is successful. If it's not, then we try it again but before we do, we grab a lock:

      MutexLocker ml(Heap_lock);

MutexLocker is a subclass of StackObj, indeed the way we instantiate it in the above line of C++ code shows that this is going to be allocated on the stack. When the stack data is popped, the lock will automatically unlock itself. No need for something like Java's try/finally block here because our thread will execute the destructor of this object which looks like:

  ~MutexLocker() {
    _mutex->unlock();
  }

If this second attempt to allocate space in the young generation fails, we'll try to allocate space in the old generation:

      result = mem_allocate_old_gen(size);

This method is interesting as first it sees if the size required is greater than half of the capacity of Eden. If it can, job done and the method returns. If not, it checks if there is a "death march" taking place. From the comments:

A "death march" is a series of ultra-slow allocations in which a full gc is done before each allocation, and after the full gc the allocation still cannot be satisfied from the young gen.

If there is such a death march taking place, it will do the following 64 times: it will try to allocate the memory in the Old Generation, first by not expanding the heap, then (if forced) by seizing a lock and expanding the heap through all sorts of tricks (see PSOldGen::expand(size_t bytes) for more details) and even possibly putting the thread to sleep for a while.

If a GC is needed, the thread might stall and try the whole process again. If the thread thinks a JNI thread is an issue, it may fail.

If all this still does not provide enough space, the thread requests a GC. It cannot do this itself as only VM threads are allowed to GC, not application threads. So, it requests the VM thread to GC and puts itself to sleep (VMThread::execute). The VM thread then tries to allocate memory in the Young Generation just like the application thread did. Failing that, it tries to do a full collection (see ParallelScavengeHeap::failed_mem_allocate which calls ParallelScavengeHeap::do_full_collection) first without clearing all the soft references then if that doesn't work, it tries to clear them. A full collection can be expensive. Typically it was OK but with our 4gb heaps it was not unusually to see them last a couple of seconds.

If this fails, it's back into the loop until a given number of attempts has been made.

If all this fails, out of memory errors are thrown and the heap may be dumped depending on the JVM's arguments.


Saturday, August 2, 2014

Heartbleed and the JVM


The Heartbleed bug that affected OpenSSL earlier this year was a failure to do a proper bounds check. It allowed the client to define how much memory it was assigned in the server. The server then might have only filled some of this memory but all of its contents were returned to the client. The problem in a language like C is that this memory might be dirty. That is, it may contain other peoples' discarded data.

The patch was to check the bounds so no superfluous data was returned to the client. But why was the data not clean in the first place?

Basically, it's an optimization. Clearing the content of memory is expensive.

Java is much more secure than C. If you grab some off-heap memory, it cleans it before giving it to you. If you call ByteBuffer.allocateDirect(int) you are given an instance of a packge protected class, DirectByteBuffer. In its constructor you see:

            base = unsafe.allocateMemory(size);

where unsafe is an object of class sun.misc.Unsafe. The method allocateMemory takes us to unsafe.cpp in OpenJDK where we see:

  void* x = os::malloc(sz, mtInternal);
  if (x == NULL) {
    THROW_0(vmSymbols::java_lang_OutOfMemoryError());
  }
  //Copy::fill_to_words((HeapWord*)x, sz / HeapWordSize);
  return addr_to_java(x);

This doesn't clean the memory (that's done later). But as an interesting aside, set -XX:+PrintMalloc as a command line parameter and you'll see the JVM output lines like:

os::malloc 536870912 bytes --> 0x00007f1ce7fff028

Anyway, the cleaning of the memory comes here, a few lines later in DirectByteBuffer:

        unsafe.setMemory(base, size, (byte) 0);

which is a call to:

UNSAFE_ENTRY(void, Unsafe_SetMemory(JNIEnv *env, jobject unsafe, jlong addr, jlong size, jbyte value))
  UnsafeWrapper("Unsafe_SetMemory");
  size_t sz = (size_t)size;
  if (sz != (julong)size || size < 0) {
    THROW(vmSymbols::java_lang_IllegalArgumentException());
  }
  char* p = (char*) addr_from_java(addr);
  Copy::fill_to_memory_atomic(p, sz, value);
UNSAFE_END

Despite the mention of filling atomically, this call to the Copy class looks no more complicated than something like this:

    for (uintptr_t off = 0; off < size; off += sizeof(jlong)) {
      *(jlong*)(dst + off) = fill;
    }

The consequence of this security is a loss of performance:

"It's a well known fact that direct bytebuffer allocation is much slower than non direct byte buffers.

"If you think about it when you allocate a non direct byte buffer then it basically just needs to dereference a pointer to some memory on the Java heap, which is very quick. But for a direct buffer, it has to malloc real memory from the OS, and do a bunch of other house keeping.

"So yes, if you're using direct byte buffers it pays to re-use them."

https://community.jboss.org/thread/82231


Monday, May 26, 2014

Debugging the JVM


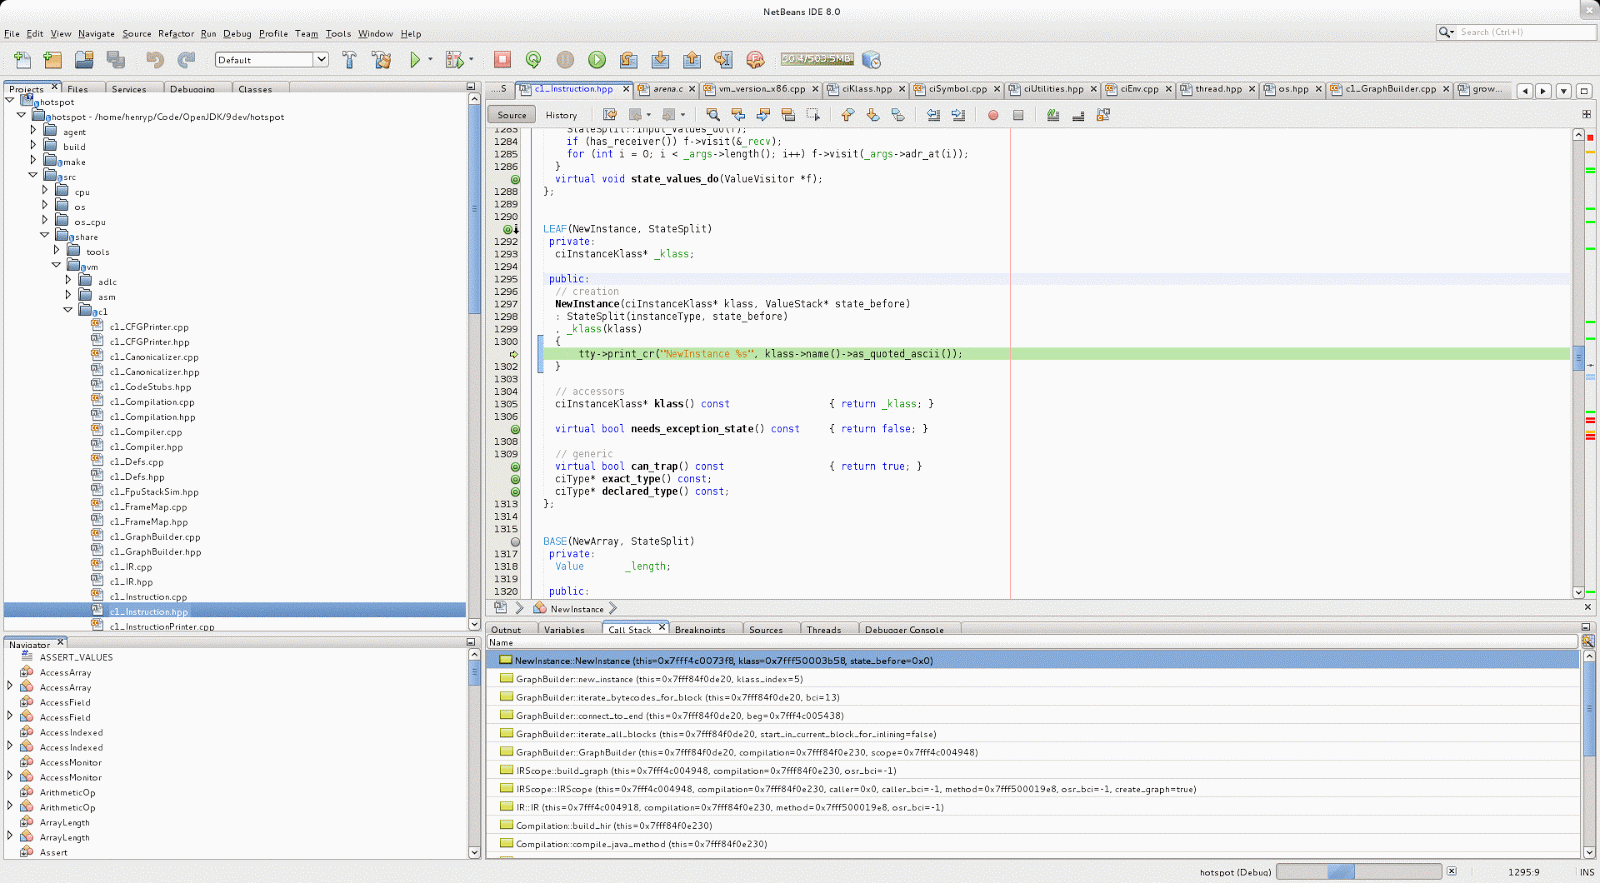
This is very nice. I've built my own JDK on Linux and am stepping through the C++ code as if it were a normal Java debug.


To do this:

1. Get the source code with:

hg clone http://hg.openjdk.java.net/jdk9/dev 9dev

2. Build with something like:

$ bash ./configure --with-debug-level=slowdebug --enable-debug-symbols ZIP_DEBUGINFO_FILES=0
$ make all CONF=linux-x86_64-normal-server-slowdebug ZIP_DEBUGINFO_FILES=0

or whichever CONF is appropriate to your system. This last step can take quite a long time (about 10 minutes).

The ZIP_DEBUGINFO_FILES is important (see here and here). This compiles the symbols into the artifact that allow debugging.

[Note: sometimes, I saw errors like:

gmake[2]: *** [/home/henryp/Code/OpenJDK/9dev/build/linux-x86_64-normal-server-slowdebug/jdk/demo/jpda/examples.jar] Error 1
gmake[2]: *** Waiting for unfinished jobs....
Note: Some input files use or override a deprecated API.
Note: Recompile with -Xlint:deprecation for details.
Note: Some input files use unchecked or unsafe operations.
Note: Recompile with -Xlint:unchecked for details.
gmake[1]: *** [demos] Error 2
make: *** [demos-only] Error 2

which were worrying. In the event of this, I ran make again and it worked. Hmm.]

3. Install NetBeans 8.x. Although I am normally an Eclipse man, NetBeans is frankly better for C/C++ development.

4. Create a new C/C++ application in the hotspot directory. 

5. Choose a Java main class to run by right clicking on the project properties and in the "Run" Category. Choose the class to run using the artifact that was built, eg something like:

"${OUTPUT_PATH}" -classpath /home/henryp/Workspaces/workspaceKepler/_MyTests/bin com.phenry.memory.ObjectCreatorMain

6. Insert your breakpoints wherever you wish and press the debug button. Note, if you are remote debugging and your system has been "hardened" for security reasons, you may have some trouble. Follow the instructions here (and the subsequent link) to turn off the security.

A Caveat

Finally, when debugging, you will be using Linux tools. I had problems on an Ubuntu 12.04 system as the tools were not up-to-date (the debugger acts erratically when debugging multi-threaded code). On my Fedora system, everything was fine. The versions I was using were:

[henryp@corsair 9dev]$ gdb -version
GNU gdb (GDB) Fedora (7.4.50.20120120-54.fc17)
.
.
[henryp@corsair 9dev]$ gcc --version
gcc (GCC) 4.7.2 20120921 (Red Hat 4.7.2-2)
.
.